Tampilkan postingan dengan label Renewable Energy. Tampilkan semua postingan

Measurement of the Higgs boson mass and width using the four-lepton final state in proton-proton collisions at √s = 13 TeV

 Measurement-of-the-Higgs-boson-mass-and-width-using-the-four-lepton-final-state-in-proton-proton-collisions-10


A measurement of the Higgs boson mass and width via its decay to two Z bosons is presented. Proton-proton collision data collected by the CMS experiment, corresponding to an integrated luminosity of 138 fb^−1 at a center-of-mass energy of 13 TeV, is used. The invariant mass distribution of four leptons in the on-shell Higgs boson decay is used to measure its mass and constrain its width. This yields the most precise single measurement of the Higgs boson mass to date, 125.04 ± 0.12 GeV, and an upper limit on the width Γ H < 330 MeV at 95% confidence level. A combination of the on-and off-shell Higgs boson production decaying to four leptons is used to determine the Higgs boson width, assuming that no new virtual particles affect the production, a premise that is tested by adding new heavy particles in the gluon fusion loop model. This result is combined with a previous CMS analysis of the off-shell Higgs boson production with decay to two leptons and two neutrinos, giving a measured Higgs boson width of 3.0 +2.0, −1.5 MeV, in agreement with the standard model prediction of 4.1 MeV. The strength of the off-shell Higgs boson production is also reported. The scenario of no off-shell Higgs boson production is excluded at a confidence level corresponding to 3.8 standard deviations.


Higgs boson mass and width measurements with on-shell production

The Higgs boson mass and width are measured, using on-shell production, by fitting the m4â„“ distribution in the mass range 105 < m4â„“ < 140 GeV. The results have been determined using the CMS statistical analysis tool COMBINE, which is based on the ROOFIT and ROOSTATS frameworks. Table 1 shows the mass measurements obtained from the 1D approach, where no further assumptions have been made. In comparison to the 1D model, the 1D′BS model reduces the uncertainty by about 15%. Implementing the δm4â„“/m4â„“ categorization then gives the N –1D′BS model, which leads to an additional 10% improvement. Finally, using the D kin, bkg discriminant to reduce the background produces the N –2D′BS model with another 4% improvement. Table 5 shows the resulting m4â„“ measurements using this last model. All the measured m4â„“ values from the different fits are statistically compatible, given their uncertainties and correlations. Figure 1 displays the observed 1D likelihood scans as functions of mH, from the fits for the different 4â„“ categories and combined. Combining all the m4â„“ final states and data-taking years, our final result is mH = 125.04 ± 0.11 (stat) ± 0.05 (syst) = 125.04 ± 0.12 GeV. The largest systematic uncertainty is from the lepton momentum scale and equals 0.03 and 0.04 GeV for final states with muons and electrons, respectively. 

Table 1: Best fit values for the mass of the Higgs boson measured in the inclusive 4â„“ final state and separately for different flavor categories using the 1D approach. Uncertainties are separated into statistical and systematic uncertainties. Expected uncertainties are also given assuming mH = 125.38 GeV 

Measurement-of-the-Higgs-boson-mass-and-width-using-the-four-lepton-final-state-in-proton-proton-collisions-1

Table 2: Best fit values for the mass of the Higgs boson measured in the inclusive 4â„“ final state and separately for different flavor categories, using the final fit configuration (N –2D’BS). Uncertainties are separated into statistical and systematic uncertainties. Expected uncertainties are also given assuming mH = 125.38 GeV.

Measurement-of-the-Higgs-boson-mass-and-width-using-the-four-lepton-final-state-in-proton-proton-collisions-2


As a check on the analysis technique and the systematic uncertainty from this method, the 1D′BS model is applied to Z → 4â„“ events in the m4â„“ range 70–105 GeV. The signal shape is obtained using a convolution of a Breit–Wigner function and a double-sided Crystal Ball function. The fitted values of mZ in different subchannels are m4µ Z = 91.02 ± 0.14 GeV, m4e Z = 91.18 ± 0.45 GeV, m2e2µ Z = 91.40 ± 0.29 GeV, and m2e2µ Z = 91.40 ± 0.37 GeV, leading to a combined value of mZ = 91.17 ± 0.12 GeV, consistent with the world-average Z boson mass and with the uncertainty in agreement with the expected value of ± 0.12 GeV from simulation. The results from this analysis are combined with those extracted using data recorded with the CMS detector during Run 1 at √ s = 7 and 8 TeV. Since this analysis uses an improved method to extract the systematic uncertainties affecting lepton momentum, the lepton energy scales and resolution uncertainties are considered uncorrelated between the two runs. The combined observed result from both data-taking periods is mH = 125.08 ± 0.12 GeV = 125.08 ± 0.10 (stat)±0.05 (syst) GeV. The corresponding expected statistical and systematic uncertainties are ±0.10 and ±0.05 GeV, respectively. Figure 2 presents a summary of the Higgs boson mass measurements by the CMS Collaboration in the four-lepton decay channel.


Measurement-of-the-Higgs-boson-mass-and-width-using-the-four-lepton-final-state-in-proton-proton-collisions-3

Figure 1: The profile likelihood from the mH fit using the N –2D′BS model for each of the 4â„“ categories and combined. The change in likelihood corresponding to 68 and 95% CLs are shown by the dashed horizontal lines. Both statistical and systematic uncertainties are included in the fits.


Measurement-of-the-Higgs-boson-mass-and-width-using-the-four-lepton-final-state-in-proton-proton-collisions-4

Figure 2: Summary of the CMS Higgs boson mass measurements using the four-lepton final state. The red vertical line and the gray column represent the best fit value and the total uncertainty, respectively, as measured by combining the Runs 1 and 2 data. The yellow band and horizontal black bars show the statistical and total uncertainties in each measurement, respectively. The value of each measurement is given, along with the total and statistical only (in parentheses) uncertainties.


 Higgs boson width measurement with off-shell production

Table 3: Summary of the total Higgs boson width ΓH measurement, showing the 68% CL (central values with uncertainties) and 95% CL (in square brackets) intervals for the H → ZZ → 4â„“ channel alone and in combination with the off-shell H → ZZ → 2â„“2ν channel.

Measurement-of-the-Higgs-boson-mass-and-width-using-the-four-lepton-final-state-in-proton-proton-collisions-5

Measurement-of-the-Higgs-boson-mass-and-width-using-the-four-lepton-final-state-in-proton-proton-collisions-6
Figure 3: Observed (solid) and expected (dashed) profile likelihood projections from the Higgs boson width fit using on- and off-shell production from this analysis. The analysis of the offshell H → ZZ → 4â„“ channel combined with the on-shell H → ZZ → 4â„“ channel is shown in black. The full combination of H → ZZ → 4â„“ with the off-shell H → ZZ → 2â„“2ν is given in red. The black horizontal dashed lines show the 68 and 95% CL values. 


The observed limits on Î“H are stronger than the average expected values from simulation. This is supported by the upper left, where the number of observed events in the sensitive region of m4â„“ > 340 GeV and Dbkg > 0.6 in the Untagged category is below the expected value, but still consistent with it. The smaller number of events in this region favors the hypothesis of negative interference between the signal and background contributions, which dominates over the pure signal contributions for Î“H values near the SM value. Therefore, large and very small values of ΓH are disfavored. 


A measurement of the Higgs boson mass (mH) and width (ΓH) using the decays to two Z bosons is presented. The data sample comes from proton-proton collisions at the LHC recorded by the CMS experiment at a center-of-mass energy of 13 TeV, corresponding to an integrated luminosity of 138 fb−1 . On-shell Higgs boson production with the H → 4â„“ decay (â„“ = e, µ) is used to measure its mass and constrain its width. The mass measurement yields mH = 125.04± 25.

 Table 4: Measured values of the signal strengths µ off-shell , µ off-shell, F , and µ off-shell, V , and their 68% and 95% (in square brackets) CL intervals from the combined fit to the off-shell H → ZZ → 4â„“ and 2â„“2ν channels.

Measurement-of-the-Higgs-boson-mass-and-width-using-the-four-lepton-final-state-in-proton-proton-collisions-7


Measurement-of-the-Higgs-boson-mass-and-width-using-the-four-lepton-final-state-in-proton-proton-collisions-8
Figure 4: Observed 2D profile likelihood projection of the off-shell signal strength parameters (µ off-shell, F , and Âµ off-shell, V  ) from the fit to the combined off-shell H → ZZ → 4â„“ and 2â„“2ν channels. The best fit value is shown by the black cross and the SM prediction by the red x. The 68 and 95% CL contours are given by the dashed and solid curves, respectively. The color scale to the right of the plot relates the quantitative values. 


0.11 (stat) ± 0.05 (syst) GeV = 125.04 ± 0.12 GeV, in agreement with the expected precision of ±0.12 GeV. From on-shell production events, an upper limit of Î“H < 330 MeV is set at 95% confidence level. The mass measurement is further improved by combining data from Runs 1 and 2, leading to the most precise single measurement of the mass to date in this channel, mH = 125.08 ± 0.10 (stat) ± 0.05 (syst) GeV = 125.08 ± 0.12 GeV. Using on- and off-shell Higgs boson production with the decay to four leptons, and combining them with a separate analysis with Higgs boson decay to two leptons plus two neutrinos, we measure Î“H = 3.0+2.0, −1.5 MeV, consistent with the standard model prediction of 4.1 MeV. These results are summarized in Table 5. The strength of the off-shell Higgs boson production is also reported, and the scenario of no off-shell Higgs boson production is excluded at a confidence level corresponding to 3.8 standard deviations. Results of the measurements are tabulated in the HEPData record for this analysis.


Table 5: Summary of the Higgs boson mass and total width Î“H measurements, showing the allowed 68% CL (central values with uncertainties) and 95% CL (in square brackets) intervals. Uncertainties are reported as a combination of statistical and systematic uncertainties. The first two rows display the outcomes of the analysis conducted within the on-shell H → ZZ → 4â„“ region, where the width is restricted to be positive. The third row incorporates results from the off-shell H → ZZ → 4â„“ region combined with the on-shell H → ZZ → 4â„“ and off-shell H → ZZ → 2â„“2ν.

Measurement-of-the-Higgs-boson-mass-and-width-using-the-four-lepton-final-state-in-proton-proton-collisions-9

                                                       ====== Physics =======


Read more:

Ultrafast Switch from a Bose-Einstein Condensate Matter - Practicalintroduction

A Theoretical Perspective : Spin−Orbit Coupling in 2D Semiconductors

Bill Gates Reveals Technology That Will Dethrone Smartphones, What The Technology Is?

Neuromorphic Spintronics - Neuromorphic Computing with Spin Torque Nano-oscillators

Cellular Lasers for Cell Imaging and Biosensing


References :

S. L. Glashow, “Partial-symmetries of weak interactions”, Nucl. Phys. 22 (1961) 579, doi:10.1016/0029-5582(61)90469-2. 

F. Englert and R. Brout, “Broken symmetry and the mass of gauge vector mesons”, Phys. Rev. Lett. 13 (1964) 321, doi:10.1103/PhysRevLett.13.321. 

CMS Collaboration, “The CMS statistical analysis and combination tool: COMBINE”, Comput. Softw. Big Sci. 8 (2024) 19, doi:10.1007/s41781-024-00121-4, arXiv:2404.06614. 

W. Verkerke and D. P. Kirkby, “The RooFit toolkit for data modeling”, in Proceedings of the 13th International Conference for Computing in High-Energy and Nuclear Physics (CHEP03). 2003. arXiv:physics/0306116. 

L. Moneta et al., “The RooStats project”, PoS ACAT2010 (2010) 057, doi:10.22323/1.093.0057, arXiv:1009.1003. 

CMS Collaboration, “A measurement of the Higgs boson mass in the diphoton decay channel”, Phys. Lett. B 805 (2020) 135425, doi:10.1016/j.physletb.2020.135425, arXiv:2002.06398. 

Particle Data Group, K. A. Olive et al., “Review of Particle Physics”, Chin. Phys. C 38 (2014) 090001, doi:10.1088/1674-1137/38/9/090001. 

CMS Collaboration, “Measurement of the properties of a Higgs boson in the four-lepton final state”, Phys. Rev. D 89 (2014) 092007, doi:10.1103/PhysRevD.89.092007, arXiv:1312.5353.

“HEPData record for this analysis”, 2024. doi:10.17182/hepdata.153670.


Share:

Industri Baterai Lithium Kunci Menuju Masa Depan Bersih Indonesia


practicalintroduction.com

Indonesia, dengan kekayaan alamnya yang luar biasa, telah lama menjadi pahlawan dalam pasar komoditas global, terutama untuk tambang mineral seperti nikel dan timah. Tapi sekarang, di tengah revolusi energi global yang berfokus pada sumber daya bersih dan energi terbarukan, saatnya kita menyoroti kekayaan lain yang kita miliki: litium.


Litium adalah unsur kimia ringan yang menjadi komponen utama dalam baterai lithium-ion, teknologi penyimpanan energi yang mendukung revolusi energi terbarukan dan kendaraan listrik. Selama beberapa tahun terakhir, litium telah menjadi komoditas yang sangat dicari di pasar global, dan Indonesia memiliki potensi besar untuk menjadi pemain kunci dalam industri baterai lithium ini.


Potensi Litium Indonesia


Indonesia memiliki cadangan litium yang signifikan, terutama di bagian timur Indonesia seperti Papua dan Nusa Tenggara Timur. Sumber daya ini telah menjadi sorotan industri karena permintaan global yang terus meningkat untuk baterai lithium-ion. Dalam beberapa tahun terakhir, litium telah menjadi komoditas berharga yang harganya terus naik, dan ini adalah peluang besar bagi Indonesia untuk memanfaatkannya.


Selain cadangan litium yang signifikan, Indonesia juga memiliki infrastruktur yang kuat dalam pengolahan mineral. Ini termasuk fasilitas pemurnian nikel yang sudah ada, yang dapat dimodifikasi untuk menghasilkan litium, serta tenaga kerja terampil di bidang pertambangan dan pengolahan mineral. Kombinasi ini menciptakan dasar yang kuat untuk membangun industri baterai lithium yang berkelanjutan di Indonesia.


Mengintegrasikan Energi Terbarukan


Indonesia, seperti banyak negara lain di dunia, sedang berusaha untuk mengurangi ketergantungan pada energi fosil. Salah satu langkah besar menuju masa depan bersih adalah dengan mengadopsi energi terbarukan dan elektrifikasi transportasi. Inilah di mana industri baterai lithium berperan penting.


Baterai lithium-ion adalah teknologi yang mendasari di balik penyimpanan energi yang diperlukan untuk mengintegrasikan energi terbarukan seperti surya dan angin ke dalam jaringan listrik. Mereka juga menjadi komponen kunci dalam kendaraan listrik, yang semakin populer di seluruh dunia. Dengan memiliki industri baterai lithium yang kuat, Indonesia dapat mempercepat transisi ke sumber daya energi bersih dan transportasi ramah lingkungan.


Tantangan yang Harus Diatasi


Namun, untuk mencapai potensi penuhnya, industri baterai lithium di Indonesia masih harus mengatasi beberapa tantangan yang signifikan. Salah satu tantangan utama adalah masalah lingkungan. Proses penambangan dan pengolahan litium dapat memiliki dampak lingkungan yang serius, termasuk kerusakan lahan, air, dan lingkungan hidup sekitarnya. Untuk menjadi pemain global yang bertanggung jawab dalam industri ini, Indonesia harus memastikan bahwa praktik-praktik pertambangan dan pengolahan yang berkelanjutan diadopsi dan bahwa dampak lingkungan diminimalkan.


Selain itu, perlu ada investasi besar dalam penelitian dan pengembangan untuk meningkatkan efisiensi produksi baterai lithium dan mengurangi biaya produksinya. Saat ini, sebagian besar baterai lithium-ion yang digunakan di dunia diproduksi di luar Indonesia, terutama di Tiongkok. Untuk bersaing dalam pasar global, Indonesia harus memiliki teknologi dan pengetahuan yang cukup untuk memproduksi baterai dengan kualitas tinggi dan biaya yang kompetitif.


Kemitraan dan Investasi Asing


Untuk mengatasi tantangan ini, Indonesia juga dapat mencari kemitraan dan investasi asing. Beberapa perusahaan besar di industri baterai lithium telah menunjukkan minat mereka untuk berinvestasi di Indonesia. Kemitraan semacam ini dapat membawa teknologi dan pengetahuan yang diperlukan untuk mengembangkan industri ini dengan cepat.


Selain itu, pemerintah Indonesia harus menciptakan kebijakan yang mendukung pertumbuhan industri baterai lithium. Ini termasuk insentif fiskal untuk perusahaan yang berinvestasi dalam produksi baterai di Indonesia, serta regulasi yang mendukung praktik pertambangan dan pengolahan yang berkelanjutan.


Industri baterai lithium adalah peluang besar bagi Indonesia untuk menjadi pemain kunci dalam revolusi energi bersih global. Dengan cadangan litium yang signifikan, infrastruktur pengolahan mineral yang ada, dan dukungan pemerintah yang tepat, Indonesia dapat memanfaatkan potensinya dalam industri ini.


Namun, penting untuk diingat bahwa sambil mengejar peluang ini, Indonesia juga harus menjaga lingkungan dan masyarakat lokal. Dengan melibatkan berbagai pemangku kepentingan, termasuk pemerintah, perusahaan, dan masyarakat sipil, Indonesia dapat mengembangkan industri baterai lithium yang berkelanjutan dan bertanggung jawab. Ini adalah langkah menuju masa depan yang bersih dan berkelanjutan yang akan menguntungkan negara dan planet ini.


Sebagai penutup, mari kita bersama-sama merenungkan potensi besar yang dimiliki Indonesia dalam industri baterai lithium ini. Potensi itu besar, tetapi perjalanan menuju masa depan bersih tidak akan mudah. Dengan kerja sama, inovasi, dan komitmen, kita dapat menciptakan masa depan yang lebih baik, yang lebih bersih, lebih hijau, dan lebih berkelanjutan. Indonesia memiliki peluang besar untuk memimpin dalam revolusi energi bersih ini, dan saya berharap kita akan mengambil kesempatan ini dengan tangan terbuka.


Share:

Bursa Karbon Eropa Dan Peran Pentingnya Dalam Perdagangan Emisi Karbon Di Eropa


practicalintroduction.com


Bursa Karbon Eropa (ECE)


Bursa Karbon Eropa, atau European Carbon Exchange (ECE), adalah pasar perdagangan karbon yang beroperasi di Eropa. Ini adalah bagian dari Sistem Perdagangan Emisi Uni Eropa (EU ETS), yang merupakan salah satu inisiatif terbesar di dunia untuk mengurangi emisi gas rumah kaca dan mengatasi perubahan iklim.


Sejarah dan Latar Belakang


Bursa Karbon Eropa didirikan sebagai respons terhadap Perjanjian Protokol Kyoto pada tahun 1997, yang mengharuskan negara-negara maju untuk mengurangi emisi gas rumah kaca mereka. Uni Eropa merancang EU ETS sebagai alat utama untuk mencapai target-target emisi yang ditetapkan dalam Protokol Kyoto. EU ETS secara resmi dimulai pada tahun 2005 sebagai skema perdagangan emisi karbon pertama di dunia.


Bagaimana EU ETS Berfungsi


EU ETS adalah sistem cap and trade, yang berarti bahwa ada batasan atau batas emisi yang diberlakukan bagi perusahaan-perusahaan besar yang termasuk dalam skema ini. Setiap perusahaan ini harus memiliki izin emisi karbon yang mencukupi untuk mengkompensasi emisi mereka. Izin-izin ini dikeluarkan oleh pemerintah masing-masing negara anggota Uni Eropa dan dapat diperdagangkan di pasar ECE.


Peran Bursa Karbon Eropa


Bursa Karbon Eropa adalah platform utama di mana izin-izin emisi karbon diperdagangkan. Ini memainkan peran penting dalam memastikan bahwa mekanisme cap and trade berfungsi dengan baik. Berikut beberapa peran kunci Bursa Karbon Eropa:


Perdagangan Emisi: Bursa Karbon Eropa adalah tempat utama di mana izin-izin emisi karbon, yang dikenal sebagai EU Allowances (EUA), diperdagangkan. Perusahaan-perusahaan yang membutuhkan izin tambahan untuk melampaui batasan emisi mereka dapat membelinya di bursa.


Harga Karbon: Harga karbon, yang mencerminkan nilai dari satu izin emisi karbon, ditentukan oleh kekuatan pasokan dan permintaan di pasar ECE. Harga ini memiliki dampak langsung pada keputusan bisnis perusahaan-perusahaan dalam mengurangi emisi mereka.


Transparansi dan Pengawasan: Bursa Karbon Eropa menyediakan platform transparan yang memungkinkan pemerintah, perusahaan, dan masyarakat umum untuk mengakses informasi tentang perdagangan emisi karbon. Ini memastikan bahwa semua transaksi berjalan dengan jujur dan sesuai dengan peraturan.


Inovasi Pasar: Bursa Karbon Eropa juga telah mendorong inovasi dalam instrumen-instrumen keuangan terkait karbon, seperti futures dan opsi karbon. Ini memungkinkan pelaku pasar untuk mengelola risiko dan memanfaatkan peluang dalam perdagangan karbon.


Penyelarasan dengan Kebijakan Iklim: Perubahan harga karbon di pasar ECE mempengaruhi kebijakan iklim nasional dan bisnis yang terlibat dalam produksi energi, transportasi, dan industri. Ini dapat mendorong perusahaan untuk berinvestasi dalam teknologi bersih dan mengurangi emisi mereka.


Tantangan dan Kritik


Meskipun EU ETS dan Bursa Karbon Eropa telah mencapai sejumlah kesuksesan dalam mengurangi emisi karbon di Eropa, ada juga tantangan dan kritik. Beberapa kritikus berpendapat bahwa batasan emisi yang ditetapkan belum cukup ketat untuk mengatasi perubahan iklim dengan efektif. Selain itu, terdapat masalah terkait alokasi awal izin emisi, yang telah menguntungkan beberapa perusahaan besar.


Masa Depan Bursa Karbon Eropa


EU ETS terus berkembang dan berubah seiring berjalannya waktu. Pemerintah Uni Eropa telah berkomitmen untuk meningkatkan ambisi emisi karbon dan merancang kebijakan yang lebih ketat untuk masa depan. Dalam konteks ini, Bursa Karbon Eropa akan tetap menjadi elemen kunci dalam upaya mitigasi perubahan iklim di Eropa


Bursa Karbon Eropa (ECE) adalah salah satu komponen penting dari Sistem Perdagangan Emisi Uni Eropa (EU ETS) yang bertujuan untuk mengurangi emisi karbon di Eropa. Ini adalah platform di mana izin-izin emisi karbon diperdagangkan, yang memiliki dampak besar pada kebijakan iklim dan bisnis di wilayah ini. Meskipun ada tantangan dan kritik, ECE terus berperan dalam upaya mengatasi perubahan iklim dan mendorong transisi menuju ekonomi yang lebih berkelanjutan.


Share:

Mesothelioma Class-Action Lawsuit from Exposure to Asbestos

practicalintroduction.com


The two types of mesothelioma lawsuits are personal injury and wrongful death claims. A mesothelioma personal injury lawsuit allows the cancer patient to seek compensation from the company or companies that exposed them to asbestos. The average compensation from a mesothelioma lawsuit trial is $2.4 million.


Types of Mesothelioma Lawsuits

If your family is bearing the burden of mesothelioma, an asbestos exposure lawsuit may be right for you and your loved ones. 


You may be eligible to file a personal injury lawsuit if you were diagnosed with mesothelioma, or a wrongful death lawsuit if you lost a loved one to the disease.


The steps for filing a mesothelioma lawsuit vary depending on the type of claim filed.

practicalintroduction.com


Personal Injury Lawsuit

A person diagnosed with mesothelioma may file a personal injury lawsuit against the companies responsible for exposing them to asbestos. 


Asbestos liability is usually based on companies’ failures to warn employees and consumers about the dangers linked to inhaling the toxic mineral. If the lawsuit is successful, the mesothelioma patient receives compensation for their injury.


Wrongful Death Lawsuit

The estate of a deceased mesothelioma patient may file a wrongful death claim seeking compensation to cover medical bills, funeral expenses and lost income. 


Similarly, if a mesothelioma patient files a personal injury lawsuit but dies before it is resolved, the estate may continue the claim. When compensation is awarded in wrongful death lawsuits, the estate is the recipient. (iv)


Share:

Who Is Eligible to File an Asbestos Lawsuit

practicalintroduction.com

Who Is Eligible to File an Asbestos Lawsuit?

You are typically eligible to file a mesothelioma lawsuit if you can provide documentation of the mesothelioma diagnosis, including medical reports from the cancer center where you or your loved one were treated, and are within the statute of limitations. You must also document the asbestos exposure history that caused the mesothelioma. This can include employment records as well as detailed descriptions and testimony about the asbestos exposure.


Alternatively, you may be eligible to file a wrongful death lawsuit if you lost a loved one to mesothelioma. You would serve as the representative of your loved one’s estate.


If an asbestos company is liable for your exposure and they filed for bankruptcy, your lawyer may help you file a trust fund claim instead of a lawsuit. Your options for compensation may also include private health insurance, Medicare or Medicaid, Social Security disability benefits or filing a claim with the Department of Veterans Affairs.


You may be able to file a mesothelioma lawsuit outside of the state in which you live depending upon the details of your case. An experienced mesothelioma attorney can help you and your family decide the best court in which to file your asbestos claim. According to a leading industry report, more than 3,600 mesothelioma claims were filed throughout the U.S. in 2020.


Statute of Limitations on Asbestos Lawsuits

In personal injury and wrongful death lawsuits, plaintiffs must file a claim soon after an injury occurs or is discovered. Statutes of limitations set a time limit, usually around two years, for a plaintiff to file a lawsuit after they are injured or discover their injury.


You should speak with a mesothelioma lawyer to ensure you are within the statute of limitations to file your claim.


Share:

Why File an Asbestos Lawsuit?

practicalintroduction.com

Why File an Asbestos Lawsuit?

Compensation from an asbestos lawsuit can reduce financial hardships for you and your family. Mesothelioma lawsuits can provide money for medical and travel expenses, pain and suffering related to the illness and a better financial future for your loved ones.


A qualified mesothelioma attorney can help you decide whether to pursue a lawsuit and guide you through the process. If you choose to file a claim, you would sue manufacturers of asbestos products rather than the government or military, if you were exposed while serving.


practicalintroduction.com


Filing a Mesothelioma Lawsuit

First, you must find an attorney who will prepare and file a written complaint with a court to start the legal process. 


Filing and the steps that follow may take several months, but if you are very sick, your attorney may ask the court to speed the process along before your condition worsens. Your attorney will guide you and represent you every step of the way.


1. Choose an Attorney


The first step in a successful filing process is choosing an attorney experienced in asbestos litigation. Top mesothelioma law firms will provide you with a free consultation to talk about your case and go over your legal options.


2. Case Review and Preparation


Answer your attorney’s questions about your asbestos exposure history, work history and medical history. This is part of a mesothelioma case review. Work with your lawyer if they need additional testimony for your case. You might need to answer additional questions about your work history and asbestos exposure history.


Your attorney will research what claim and compensation options best fit your needs. Whether you file a personal injury lawsuit, a wrongful death lawsuit or a claim with an asbestos trust, a skilled attorney will help you prepare all the documentation needed to support your claim.


3. File Mesothelioma Lawsuit

After the relevant information is gathered, your attorney will file your lawsuit on your behalf and manage the legal proceedings. They will advise you on whether to take a settlement offer or negotiate for additional compensation.


4. Responses and Discovery

Each defendant in your lawsuit will receive a copy of your complaint. They will have a certain amount of time, usually 30 days, to respond. Defendants rarely admit fault. They most likely will deny your claims and argue your complaint is not valid, or they may contend that someone else is responsible for your exposure to asbestos. Your attorney will reply to each defendant’s responses.


Lawyers on both sides will gather information about your allegations, asking the other side to answer written questions, produce documents and participate in depositions. Some of the information may become evidence used at trial. You may need to participate in a videotaped deposition and answer questions under oath from the defendants’ lawyers. This is often done from the comfort of your own home and under the guidance of your attorney.


5. Settlement or Trial

Before a trial starts, defendants may offer to resolve the case by offering you money. Mesothelioma settlements depend on multiple factors and can influence your decision whether to go to trial. If you decline a settlement offer, it’s possible the defendant will make another offer. Your attorney will negotiate on your behalf.


Going to trial is rare. Even if a case does go to court, you may not be required to appear. The trial process varies depending on where you file a claim. Results depend on your history of asbestos exposure, the state where the lawsuit is filed, your medical history and other factors. If you win and the defendant does not appeal, you will usually start receiving payments a few months after the verdict.


6. Resolution

If you win the trial, defendants may decide to file an appeal. There is a limited amount of time to file an appeal, usually between 30 and 180 days from the time the verdict is given. This will delay any monetary award, but defendants will need to post “bond” for the amount awarded while the appeal proceeds.


If the defendants lose their appeal, you will start receiving payments. If the appeal is successful, defendants may end up paying a smaller amount or nothing at all.


Notable Asbestos Lawsuit Verdicts

In 2022, Weitz & Luxenburg secured $43 million for a mesothelioma patient after a jury found Algoma Hardwoods, Inc. responsible for asbestos exposure.


These payouts are known as trial verdicts, and they are often higher than what a patient may receive from a settlement offer or a trust fund claim:


$250 million awarded to a retired steel worker in 2003 over exposure to asbestos insulation


$75 million awarded to the wife of a race car driver in 2017 over exposure to asbestos-containing engine gaskets


$48 million awarded to the family of a construction worker in 2012 over exposure to asbestos in building materials


$29.4 million awarded in a talc lawsuit to a long-time talcum powder user in 2019 over exposure to asbestos-contamination


$18.6 million awarded to the family of a factory worker in 2014 over asbestos exposure at a tire plant


$18 million awarded to a barber’s son in 2016 over exposure to asbestos-contaminated talcum powder


Share:

Artificial Intelligence for Energy Efficiency and Renewable Energy – 6 Current Applications - Qlael Practicalintroduction


The U.S. Energy Information Agency (EIA) defines renewable energy as an energy source that naturally regenerates, such as solar or wind. In contrast, fossil fuels are considered finite. The EIA reports that in 2016, 10 percent of all energy consumed in the U.S. was derived from renewable energy sources. This is equivalent to roughly “10.2 quadrillion British thermal units (Btu) —1 quadrillion is the number 1 followed by 15 zeros”.


Despite the increasing use of renewables which notably became the leading global source of electricity in 2015, there are still persistent barriers to wider implementation related to policy and technology. Researchers and companies are exploring how artificial intelligence could assist in improving the accessibility and efficiency of renewable energy technology.


In this article, we present examples of renewable energy technologies which incorporate AI. We cover three major categories of renewable technologies that should be of interest to business leaders in the green energy space:


  • Energy Forecasting  – Industry data is used to train AI algorithms to make accurate forecasts, helping to inform power supply and demand
  • Energy Efficiency – AI is used to track and optimize how energy efficiency
  • Energy Accessibility – AI is used to model utility cost savings and provide recommendations for smart home investments

For each application, we provide a company overview, an explanation of how the platform functions, and outcome data and/or results were available. Each example is organized under a sub-heading which serves as a quick reference when navigating through the article.


AI for Energy Forecasting


Xcel


A consistent challenge with renewable energy sources such as wind and solar power is their unreliability. Weather-dependent power sources will often fluctuate in their strength.


In Colorado, energy provider Xcel is implementing AI in an attempt to address these challenges. Through the National Center for Atmospheric Research’s new AI-based data mining method, Xcel was able to reportedly access weather reports with a higher level of accuracy and detail.


This meant that greater precautions could be taken to harness and preserve the energy that was generated. In order to provide these detailed weather reports, the AI system mines a combination of data from local satellite reports, weather stations as well as wind farms in the surrounding area.  The algorithms driving the system are trained to identify patterns within these data sets and make predictions based on those data points.  


Xcel reports that wind power has doubled in Colorado since 2009. Earlier this year, Xcel reported plans to expand its wind farms by 50 percent by the year 2021.


Nnergix


Weather can often be unpredictable, destabilizing the power supply generated from weather-dependent energy sources such as solar and wind. This puts pressure on the renewable energy sector to efficiently balance supply and demand.


Historically, weather forecasts have helped energy suppliers make predictions regarding their power supply.  Today, companies such as Nnergix are incorporating artificial intelligence to improve the accuracy of renewable energy forecasting.


Nnergix is a data mining and web-based energy forecasting platform which pools data from the energy industry. The company reportedly combines satellite data from weather forecasts and machine learning algorithms trained on industry data to make more accurate forecasts.


High-resolution weather forecasts appear to be generated from satellite images. Large-scale and smaller-scale weather models are reportedly generated based on these images. The machine learning algorithms analyze these data and can then predict the state of the atmosphere for a particular area.


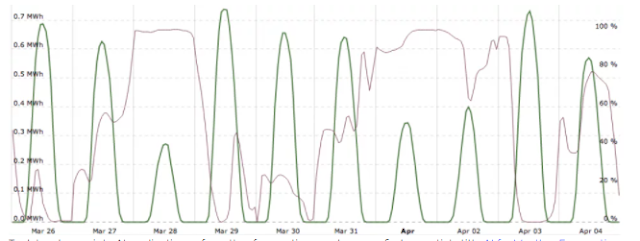
For example, the company offers three main services including a solar energy solution, and claims that forecasts can range from 6 hours to ten days in advance with data updates occurring eight times a day. Reports can be delivered in multiple formats in as depicted in the graph below:


practicalintroduction.com


To delve deeper into AI applications of weather forecasting, readers may find our article titled AI for Weather Forecasting – In Retail, Agriculture, Disaster Prediction, and More to be a useful resource.


AI for Energy Efficiency


Verdigris Technologies


Founded in 2011, California-based Verdigris Technologies offers a cloud-based software platform that claims to leverage artificial intelligence to help clients optimize energy consumption. Designed for large commercial buildings and managers of enterprise facilities, the process begins with the installation of IoT hardware.


Smart sensors are directly attached to the client’s electrical circuits to track energy consumption. The data captured by the sensors is sent to the cloud “securely over Wi-Fi or Verizon 4G/LTE.” and is presented to the client on a dashboard that is accessible online 24/7.


The involvement of Verizon runs a bit deeper than a wireless connection. In October 2016, corporate Venture Capitalist firm Verizon Ventures made an undisclosed investment in a Series A funding round amounting to $6.7 million. To date, Verdigris has raised over $16.5 million in total funding.


Every appliance tends to have a unique electrical footprint, as a result, the algorithms have been designed to be able to identify each unique energy source while still providing a comprehensive analysis of the captured by the smart sensor hardware. The data analysis is communicated to Verdigris’ cloud-based servers.


In one case study, Verdigris reports that it worked with W Hotel San Francisco to identify energy inefficiencies in the hotel’s commercial kitchen. Within a three-month period, the company reportedly identified inefficiencies that were costing the hotel more than $13,000 in preventable annual losses.


Google DeepMind


Founded in London in 2010 and acquired by Google in 2014, AI company DeepMind Technologies Ltd. reportedly reduced the amount of energy required to cool Google’s data centers by 40 percent.

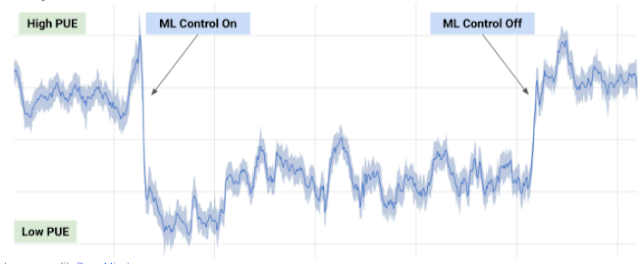
DeepMind reported these results in July 2016, however, the company claims that it first began applying machine learning two years prior to improve energy usage. Specifically, a set of data center operating scenarios and parameters were used to train a system of neural networks. The neural network “learned” how the data center functioned and began identifying opportunities for optimization.


Google claims that data was pulled from thousands of sensors located in the data centers. Information collected included temperature and power consumption. Power Usage Effectiveness is defined as the ratio of “total building energy usage to IT usage” and was used to train the neural networks. The PUE model helps ensure efficiency so when the neural network system provides recommendations they do not exceed operating constraints.


The graph below depicts an average day where the model was tested using live data and indicates when machine learning recommendations were switched on and off.


practicalintroduction.com


Image credit: DeepMind


The Google data centers house the servers that power Google’s top applications including Gmail and Youtube which estimate over a billion users, representing roughly one-third of all internet users. Google’s capital expenditures have been reported to mainly support data center operations and improvements. In 2016, total expenditures reached an estimated $10.9 billion, up from $9.9 billion in 2015.


(DeepMind’s own Dr. Nando de Freitas joined us on our AI in industry podcast in 2016 to explain “deep learning” in simple terms – and the episode is one of our most popular of all time. Listen to the episode on Soundcloud or iTunes.)


AI for Energy Accessibility


PowerScout


In an effort to improve consumer education and access to renewable energy technologies, PowerScout reportedly uses AI to model potential savings on utility costs using industry data.


The company reportedly leverages data analytics to identify “smart home improvement projects” based on the unique features and energy usage in a client’s home. PowerScout’s algorithm appears to match clients to potential hardware installation providers in an online marketplace format to ensure competitive rates. 


Essentially, the AI acts as a marketplace advisor, providing recommendations to help clients make informed decisions regarding to make renewable energy technologies purchases for their homes. We imagine that this use of AI is similar to the recommendation capabilities seen in other marketplace businesses (which we’ve covered in greater depth in our recommendation engine use-case article). The development team claims the platform has collectively overseen the installation of solar capacity roughly equivalent to powering 250,000 homes as of March 2017.


PowerScout lists Google and the US Department of Energy among its partners. In fact, the company is the recipient of two grants from the US Department of Energy amounting to a total of $2.5 million.


Verv


Verv is an AI-powered home assistant created by London-based Green Running Ltd. The system reportedly uses its technology to assist clients with energy management in their homes.


Verv supplies energy data on home appliances and itemizes energy costs on a consistent basis. Users are reportedly able to see a record of how each appliance in their home uses energy and monitor and regulate their energy expenses before bills are due.


When a household appliance is turned on, the algorithms driving the AI assistant recognize patterns and can automate a running tally of the energy costs that the item is generating. Verv also reportedly has several safety features that provide notifications when devices are left on for prolonged periods of time as well as tips to reduce a household’s carbon footprint. The app is available for tablets, laptops, and Smartphones.


Concluding Thoughts and Future Outlook


The renewable energy sector is a growing economic force and an effective strategy towards improving environmental sustainability. Artificial intelligence is being integrated across major sectors of this industry, increasing the capacity of data analytics.


The variable nature of weather presents inherent challenges which may cause suppliers to rely on traditional energy sources to meet consumer demands. Therefore, AI-driven energy forecasting platforms may hold promise for providing energy suppliers with the data required to respond to fluctuations that may negatively affect operations and to plan accordingly.


2015 was a banner year for renewables evidenced by the commitments by the G7 and G20 to accelerate implementation and improve overall energy efficiency. However, overcoming the barriers to widespread and accelerated implementation will require ongoing evidence of benefits, particularly in the economic and political arenas.


Platforms that can accurately identify cost savings and energy efficiency for consumers and companies will prove valuable in the near term.


Readers interested in understanding how AI is being used in the traditional energy sector may find Artificial Intelligence in Oil and Gas – Comparing the Applications of 5 Oil Giants to be a useful read.(Indrawan Vpp)


Header image credit: itpro.co.uk

Share:

AI Play A Major Role in Boosting Renewable Energy - Qlael Practicalintroduction

practicalintroduction.com


INTRODUCTION

In the coming years, the world will watch as AI, machine learning, and data science transform the economy and our day-to-day lives. Perhaps no AI-enabled change has greater implications for mankind, however, than the reshaping of the energy sector. The energy sector is generally regarded as conservative in mindset and therefore slow to adopt digital technology.  After all, much of the technology that powers modern life –– coal, oil, the electrical grid –– has remained largely unchanged since the late 19th century. Yet a 2017 McKinsey report classified resources and utilities as in the middle of the pack in terms of digitization, above retail, education, and health care but behind financial services, automotive and manufacturing, and, of course, the technology sector.


However, the last few years have seen significant technological changes in the energy economy:


  • Oil and natural gas prices are low because of pioneering technology that allows companies to affordably access resources that were previously considered uneconomical.
  • Electric utilities are using machine learning to better understand their customers and deploy their resources more efficiently, cutting costs for the utility and consumers alike.
  • Meanwhile, the prospect of a renewable revolution becomes more realistic by the day largely because of major advances in AI that help generators maximize the impact of the sunshine and wind they are harnessing.


The drive to make utilities more efficient through AI, machine learning, and data science has resulted in major benefits for every actor in the energy sector, including generators, distributors, the environment, taxpayers, and consumers. There is still much to do, however, resource and utility companies that hope to remain competitive in the coming years should be aggressively pursuing the next technological frontier. This white paper will cover some of the highest-value use cases in the utilities and energy industries as well as suggested paths to scale up AI competencies within these organizations.


AI is most certainly going to play a major role in boosting renewable energy. While renewable sources, notably solar and wind power, are on the rise, they are still not capable of being the dominant energy sources due to their intermittent nature. While there have been promising advances in battery storage technology that allows utilities to store power generated from intermittent sources and dispatch it when needed, the devices remain too expensive for widespread adoption. That explains why, despite investing heavily in renewable projects, China also continues to build new coal plants at breakneck speed. And while renewables have surpassed coal in the United States, they still lag far behind natural gas, which is both cheap and dispatchable.


Data is the key to helping utilities make the most of available renewable sources. For example, AI-powered predictive analytics based on historical data help utilities forecast the weather with a precision that would have been unfathomable until recently.


Being able to predict how much sun or wind will be available two hours from now allows utilities to determine how much generated energy they should store. Predictive analytics will also help utilities optimize the search for wind or solar-generating properties so that they can know exactly how much power a given parcel of land is expected to produce. Money is pouring into ventures aimed at making renewable power more cost-effective through digital technology and AI. In fact, conventional energy giants, such as ExxonMobil, Southern Company, and Tokyo Gas are investing in renewables in anticipation of a greener energy economy in the coming decades.


In Texas, the longtime heart of America’s oil and gas economy is also the source of much of the country’s emerging wind sector; ExxonMobil is powering its oil operations in the Permian Basin with wind energy.(Indrawan Vpp)

Share:

Current Influence of China’s Ban on Plastic Waste Imports - Mikir Practicalintroduction

Plastics are polymer compounds derived from the polymerization of small molecular organic compounds such as ethylene, styrene, etc., and can be classified broadly into thermoplastic and thermosetting plastics. Since the initial invention of plastics, various kinds of plastic products have become excellent substitutes for traditional materials such as paper, wood, metal, and ceramics in various manufacturing industries because of their advantages of a lightweight, high strength, good insulation, high transparency, excellent corrosion resistance, low cost and ease of fabrication. The current global production is estimated at about 300 million tons and it is expected to reach 500 million tons by 2050, most of which will be single-use products.

The various advantages of plastics have led to expansive growth in their production and consumption and this has also resulted in serious problems such as environmental pollution and waste disposal. Plastic debris is the major pollutant listed by the EU (61%) and the USEPA (78%). However, despite much effort in developing countries, less than 10% of the generated plastic wastes are being recycled to the original materials. As a result, about 75% of the wastes floating in the marine environment are plastics, and over two-thirds of them are not biodegradable.

A study by JR Jambeck reported that over 5 million tons of plastic wastes were discarded into the oceans in 2010. The plastic debris in aquatic habitats has caused immeasurable potential harm to marine ecosystems and also to the health of terrestrial organisms. Because of the mounting problems due to plastic pollution, governments in many countries have tightened restrictions on plastic products, in particular single-use ones. China is an active participant and promoter of plastic wastes control. In April 2017, the Chinese government approved a ban on imported “recyclable” solid wastes. The ban list included 24 kinds of solid wastes, among which non-industrial plastic wastes are the most prominent. The Chinese ban became effective at the beginning of 2018 and has had a far-reaching effect on global plastic production and on solid waste management. This study examines the global response to China’s ban on plastic waste imports, the current situation on plastic waste generation and disposition in China, and future prospects for sustainable resource recovery from non-recyclable plastic wastes.

The current global production of plastics is over 300 million tons, 20% of which is produced in China. It has been estimated that about 90% of discarded plastics are not recycled. China was the world’s leading importer of waste plastics, while since January 1, 2018, China’s import ban on waste plastics has been put into force, which has had a far-reaching effect on global plastic production and solid waste management. Southeast Asian countries like Malaysia have replaced China as the leading importer of plastic wastes. As the main exporter of waste plastics, the EU has released strategies and initiatives about plastics to restrict the use of microplastics and single-use plastics. Meanwhile, main European counties like the UK, Germany, and France have also taken their own active measures to realize the control of packaging waste and non-recycled plastic and the recycling of plastic wastes in several years. As For the US, some areas such as Seattle and San Francisco have positively responded to the global trend of plastic ban. However, the controversy over “plastic restriction” in the whole state obstructed the promulgation and implementation of the national plastic ban. On the whole, major companies and more than 60 countries all over the world have introduced levies or bans to combat single-use plastic wastes. The Chinese government began to rectify the domestic waste plastics market and the Ministry of Industry and Information Technology of China has clarified the threshold of waste plastic treatment capacity for key enterprises. In addition to landfills, direct recovery and waste to energy processes are the main disposal methods of waste plastics. Thermoplastics like PE, PP, and PET that are sorted out from the waste stream by citizens can be directly recycled to the primary material. The mixed waste plastics can be used as fuel in waste to energy plants, or as feedstock to pyrolysis plants that transform them to high value-added oil or chemical materials, which are more promising disposal methods of waste plastics.

Plastic production in the whole world, Europe, and the US.

Plastics are versatile materials that could be widely used in the fields of industrial production and our daily lives. The current production of plastics consumes 6% of the global oil production and, if the current trend continues, it will increase to 20% by 2050. As shown in Fig. 1a, the annual production of plastics in the world reached 335 million tons by 2016, with an annual growth rate of about 4%. China is the largest producer of plastic products, accounting for about 29% of worldwide production, followed by the North American Free Trade Area (NAFTA) (19%) and Europe (18%). Asia accounts for nearly half of the world’s plastic production.


Types and use of plastics

Take Europe for example. The dominant plastic products are polypropylene (PP), low-density polyethylene (LDPE) and high-density polyethylene (HDPE); these three compounds amount to 49.1% of all plastics in Europe.

1. Polypropylene (PP)

Polypropylene is a semi-crystalline thermoplastic plastic. It is widely used because of its high impact resistance, strong mechanical properties, and resistance to a variety of organic solvents, acids, and alkalis. The main applications of PP include the production of long and short polypropylene fibers, woven bags, packaging bags, injection-molded products which are used for electrical, telecommunications, lighting, lighting equipment, and TV sets of fame retardant parts. PP contributes about 24% in the plastic wastes category which is the largest amount of plastics found in MSW [12]. The high demand of PP in daily life causes the amount of PP wastes to increase each year.

2. Low-density polyethylene (LDPE)

Low-density polyethylene (LDPE), also known as high-pressure polyethylene, is suitable for various molding processes. Unlike HDPE, LDPE has more branching that results in a weaker intermolecular force, lower tensile strength, and lower hardness. The main LDPE products include thin-film products, such as agricultural film, ground cover film, agricultural membrane, vegetable shed film, packaging films such as candy, vegetables, frozen food, and another packaging, liquid packaging with blow molding film (milk, soy sauce, juice, soy milk); Heavy packaging bags, shrinkage packaging films, elastic films, lined films; building films, general industrial packaging films, and food bags, etc.

3. High-density polyethylene (HDPE)

High-density polyethylene (HDPE), also known as low-pressure polyethylene, is a translucent film with high crystallinity and a certain degree of non-polarity. It is an opaque white material with a specific density lower than water (0.941– 0.960). It is soft but slightly harder than LDPE and slightly stretchable. Due to its high-strength properties, HDPE is widely used in manufacturing milk bottles, detergent bottles, oil containers, toys, and more [13]. In addition, HDPE is also used to produce packaging film, ropes, woven mesh, fishing nets, water pipes, injection molding of lower grade daily necessities and housings, non-bearing load components, rubber boxes, turnover boxes, extrusion blow molding containers, hollow products, etc.


4. Polyvinyl chloride (PVC)

PVC is formed by the polymerization of the monomer (H2C=CHCl) and, therefore, consists of about 56% chlorine and 44% carbon plus hydrogen. Some minor compounds, such as plasticizers and anti-aging agents are added in the manufacturing process to enhance the heat resistance, toughness, and ductility of PVC; they may be potentially toxic so PVC is generally not used to store food and medicine. The compatibility of PVC with other additives makes it a versatile plastic. Regular PVC products include wire and cable insulation, window frames, boots, food foil, medical devices, blood bags, automotive interiors, packaging, credit cards, synthetic leather, etc.

5. Polyurethane (PUR)

Polyurethane is the most common plastic in the thermosetting family of plastics which accounts for only a small fraction of the plastic waste stream. Polyurethane (PUR) is a polymer with a repeating structural unit of the carbamate chain made from isocyanates and polyols. The density of PUR soft foam ranges from 0.015 to 0.15 g/cm. PUR products are divided into foaming products and non-foaming products. The foaming products include soft, hard, semi-rigid PUR foam, while non-foaming products include coatings, adhesives, synthetic leather, elastomers, and elastic fibers. Foam is the most widely used PUR product.

6. Polyethylene terephthalate (PET)

Polyethylene terephthalate is formed by the polymerization of the monomer (C10H8O4)n and, therefore, it consists of about 33% oxygen with the balance of carbon and hydrogen. PET plastics have good transparency, excellent dimensional stability, and electrical insulation. Containers made of PET have high strength, good transparency, are non-toxic, and are easy to fabricate; other applications of PET include electrical insulation, printing sheets, magnetic tapes, X-ray, and other photographic films.

7. Polystyrene (PS)

Polystyrene is made by polymerization of the monomer (C8H8)n. Like other plastics, they can be colored by means of additives. It is heat resilient and it offers strength and very low density which make this polymer suitable for use in many applications, such as food packaging, electronics, construction, medical, appliances, and toys. The wide range of applications results in a large volume fraction of PS in the MSW stream. 


practicalintroduction.com

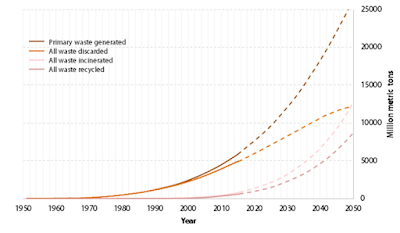
Cumulative plastic waste generation and disposal (1950–2015) and projection of historical trends to 2050.


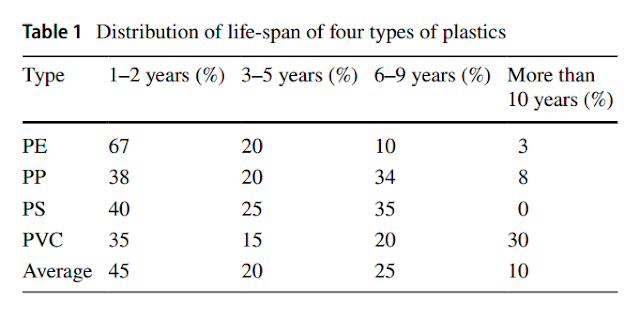
Table 1 Distribution of life-span of four types of plastics

practicalintroduction.com


practicalintroduction.com

The geography of plastic bag bans in the US (2018).


Resource recovery from plastic wastes

Thermoplastics like PE, PP, and PET that are sorted out from the waste stream by citizens can be recycled to the primary material. Waste PE, PP, and PET can be made into finished products after granulation, or be directly processed by simply cleaning, crushing, and plasticizing. The utilization mode without any modification is called direct recycling. Direct recycling is characterized by low operating costs, low equipment, and technological requirements. However, direct recycling also has a negligible deficiency. It cannot be used in the production of higher-quality products. In order to improve the quality of recycled materials, it is often necessary to add a certain proportion of virgin PE, PP, or PET materials, which accordingly increases the manufacturing cost. Modified regeneration refers to the modification of recycled materials by mechanical blending or chemical grafting, which could improve the mechanical properties of the modified regenerated products. Modified regeneration process routes are more complex and some also need specific mechanical equipment.


Combustion with energy recovery (waste to energy or WTE)

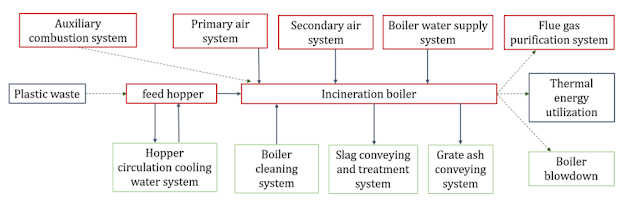
Mixed plastic wastes have a calorific value of about 35 MJ/kg which is about 85% of that of fuel oil. Therefore, they can be used to fuel power plants, in place of coal or oil. Combustion is fully controlled, does not require pretreatment of the mixed waste plastics and is a mature technology practiced in over one thousand plants worldwide, and is relatively mature. The flowsheet of a waste to energy process is shown in Fig below.

practicalintroduction.com

Process flow chart of combustion with energy recovery

The incineration of waste plastics is accompanied by the production of toxic organic gases such as polycyclic aromatic hydrocarbons, dioxins, and furans. Plastic components containing chlorine, nitrogen, and other additives will also release inorganic pollutants such as NOx and HCl during the incineration process, causing secondary pollution.

A report from environmental campaigners has claimed that UK incinerators will cause nearly £25bn of environmental harm during the next 30 years by burning plastics. Swindon Borough Council has proposed temporarily stopping the recycling of mixed plastics and instead of sending it to Energy-from-Waste. Swindon said this was because of uncertainty about exports and other markets.


Pyrolysis of plastic wastes to oil

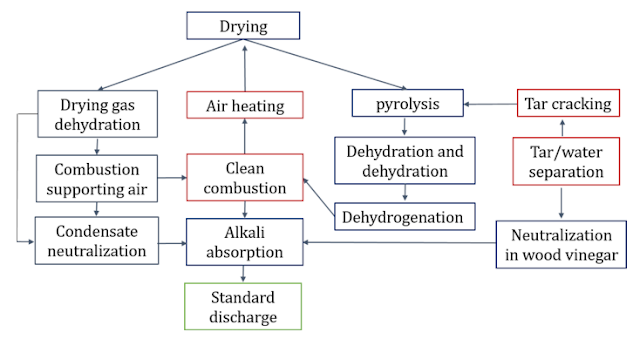
Since petroleum is the principal source of plastics manufacturing, there is great potential for transforming plastic wastes into oil through the pyrolysis process. The oil produced by pyrolysis has a high calorific value comparable to commercial fuels. Different types of plastics can be defined based on moisture, fixed carbon, volatile matter, and ash content (proximate analysis). High volatile content favors the production of liquid oils, while high ash content reduces the number of liquid oils produced, thereby increasing gaseous yield and coke formation. Most waste plastics have very high volatiles and low ash content. It should be noted that the yield and quality of the pyrolysis products depend on the operating parameters of the pyrolysis process. The main parameters include temperature, reactor type, residence time, pressure, catalyst dosage, and the type of fluidizing gas and its flow rate. Figure 9 is a process flow chart of pyrolysis and gasification of township domestic waste.


Gasification

The Gasification of waste plastics produces a stream of gases including H2, CO, CO2, CH4, and N2. A significant advantage of gasification compared to pyrolysis is that it is more flexible. Gasification of waste plastics is mainly for the production of energy-carrying gas (H2) and synthesis gas (fuel, dimethyl ether, methanol, etc.), wherein the synthesis gas has an average calorific value of about 6–8 MJ/m3. The composition and application of the gas produced by the gasification process depend on the gasifying agent used. The main problem of plastic gasification is the high tar content in gas products, which is usually higher than the tar content in biomass gasification. Therefore, the gasification of waste plastics requires a very efficient gas cleaning system.

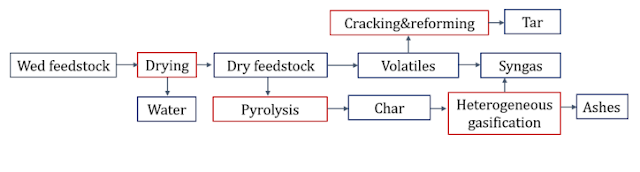
Gasification is expected to maximize the conversion of plastics into gas products or syngas. Tar and carbon are the main undesirable by-products. The gasification process includes complex chemical reactions: gas-phase drying, pyrolysis, reforming, and heterogeneous carbon gasification, which is summarized in Fig. below.

Direct recycling has advantages of low operating cost, less equipment, and processing requirements, but it can not be used to produce high-quality regenerated products. Incineration can realize energy recovery and volume reduction of waste plastics effectively whereas it will bring severe secondary pollution and the quality of the product is relatively low. Gasification has high process flexibility and high product quality. However, tar in syngas has become a serious problem in the large-scale application of gasifcation technology. Pyrolysis is not as mature as incineration, but the mild reaction conditions, easily controlled reaction process, high value-added products, and less secondary pollution make it a promising technology.


practicalintroduction.com


Industrial fow chart of pyrolysis gasifcation treatment technology


practicalintroduction.com

Flow chart of plastics gasifcation


Conclusion

This review provides concise summary of the global response to China’s ban on plastic waste imports, the current situation on plastic waste generation and disposition in China, and sustainable resource recovery technologies from non-recyclable plastic wastes. China’s import ban on waste plastics has been put into force since January 1, 2018, which led to the changes of waste plastics policy and market waste plastics globally. Southeast Asian countries like Malaysia have become the leading importer of plastic wastes. EU and the US have positively responded to China’s ban, strategy, and initiative released about plastics to restrict the use of microplastics and single-use plastics. Meanwhile, main European counties like UK, Germany, and France have also taken their own active measures in response to the China’s ban on waste plastics. In addition to the ban on waste imports, the Chinese government has also made certain regulations on the domestic waste plastics market. The global recovery rate of waste plastics is only about 10%. Waste to energy technologies based on pyrolysis and other thermal disposal means is promising technology to realize the utilization of non-recycled plastic wastes. Through comparing a variety of waste plastic disposal technologies, pyrolysis is more promising method because of its mild reaction conditions, easily controlled reaction process, high value-added products and less secondary pollution.(Indrawan Vpp)


Share:

Happy Wolrd Teacher Day

Daily Page View

Label

Adobe Acrobat Adobe Photoshop Alexa Rank Andorid Application Art Austria BUMN Beginner Belgium Blog Community Blogger Bupati Gresik CPNS/PPPK Canada Coin Market Cap Computers Cosmology Cryptocurrency Dancing Denmark Doctoral Doker Education Educational Excel Excel Table Features Film Finland French Gadget Gallery Garuda Emas Germany Google Analytics Google Form Hardware Homestay Hong Kong Ilovepdf Indrawan Vpp Interior Design Ireland Italy KKPR dan PKKPR Kampung hijau Karang Taruna Karir/Career Keyword Keywords LKPM LaTeX Linux Lowongan Kerja BUMN/SWASTA Mac Majalah Tech Material Physics Material Physics. Mechanical Engineering (ME) Microsoft 365 Microsoft Excel Microsoft Office Microsoft PowerPoint Microsoft Word NFC Nero Nero Burning 2021 Networking New Technology OSS RBA OTOMOTIF Operating Systems Optic PDF PT Aerotrans Services Indonesia (Garuda Indonesia Group) PT Astra Tol Nusantara (ASTRA Infra) PT Indomarco Prismatama (Indomaret Group) PT Indonesia Epson Industry PT Jakarta Industrial Estate Pulogadung PT Pertamina Training & Consulting (PTC) PT. Indofarma (Persero) PT. Kimia Farma Group Perizinan Berusaha Persetujuan Lingkungan Pinjaman Online Posgraduate Postgraduate PowerPoint Presentations Profil Perusahaan/Company Profil Profil-Perusahan Publisher Pyrolysis Quantum Computing Quantum Physics Quiz Renewable Energy Research SEO SWASTA Scholarship Semi conductor Semiconductor Sertifikat Halal Smartphone Spintronic Study Abroad Super Capasitor Superconductor Tata Cara Pendaftaran Surat Izin Usaha Industri (SIUI) Technology Tecnology Thailand The Best Trip & Travel Tutorial United Kingdom United Stated United States VGA card Website Windows 365 Windows Tips Word Document WordPress Zero Waste chromium tricks font iphone iphone 13 Pro iphone 13 Pro Max iphone 13 Pro Max gsmarena online zodiak